You took a second entry. The count was right: two pushes, a signal bar, a stop order one tick past it. You got filled, and price turned and went the other way. When you scroll back, the chart had been moving sideways the whole time.
That is a common way for a correct count to lose, and the count cannot warn you about it. A count describes a shape. What the shape means depends on the market around it.
This post does not teach the count. Our second entry guide and the video do that. This post is about the check that comes first: is there a trend here at all?
A second entry needs a trend to pull back in
Our guide starts from the trend. "In a trend, price rarely moves in a straight line." A first entry is "the first attempt to resume the trend after a pullback." A second entry is the second attempt.
Look at the verb in that definition: resume. The setup assumes a trend that price can go back to. The pullback is a pause, and the second push is the market going back to what it was doing before the pause.
A trading range removes that assumption. StockCharts' ChartSchool defines an uptrend as "a series of rising peaks and rising troughs (higher highs and higher lows)." A trading range is "when prices move within a relatively tight range," a sign that "the forces of supply and demand are evenly balanced." Its Dow Theory chapter calls ranges horizontal lines and says the range is "neutral until a breakout occurred."
Inside a range there is nothing to resume. A rally to the top of the box, then two small pushes up, looks exactly like a second entry long. But the top of a range is resistance. ChartSchool describes resistance as "the price level at which selling is thought to be strong enough to prevent the price from rising further." Your entry is a buy stop placed just under it.
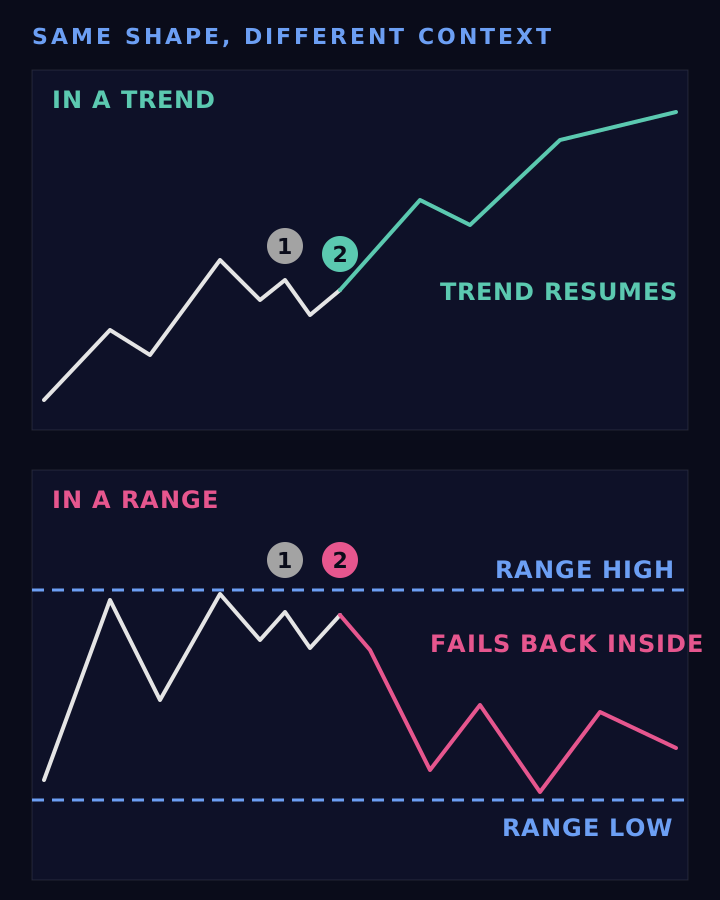
The same two pushes. In a trend, price goes back to the move. Under a range high, it falls back inside. Schematic, not a real chart.
Why the count still fires in a range
A count is mechanical. Our frequency post writes out one version of the rule. A swing high at or above the previous one "is a new high, marked 0, and it starts a count. This is the only trend context: there is no moving average and no minimum rally size."
That rule cannot see the edges of a range. A rally that reaches the top of the box again makes a high at or above the last one, so a count can start again at the top (and at the bottom, for shorts). The pattern on your chart is real, but the trend it assumes is not there.
So one answer to "why did my second entry fail" has nothing to do with counting. The count was right, and nobody checked what kind of market it was in.
How to tell a trend from a range before you take it
There are three checks, and none of them needs a special indicator. There is also no fixed number of swings that turns a pullback into a range. These checks help you judge it. They do not decide it for you.
1. Are the highs and lows still moving?
Go back to the definition. An uptrend makes higher highs and higher lows. A downtrend makes lower ones. Look at the last few swings before your setup. If the tops keep stopping near the same price, and the bottoms do too, the market is not making rising peaks and rising troughs. It is in a box.
Mark the box on the chart. NinjaTrader has a Horizontal Line drawing tool, and a Region Highlight Y tool that the help guide says will "extend the highlighting indefinitely to the right and left" across the chart. You reach both from the Drawing Tools menu when you right click the chart, or from the Drawing Tools button on the chart toolbar. With the high and low drawn, a second entry long that triggers just under the top line is easy to spot.
2. Is price crossing its average back and forth?
A moving average follows the trend and lags behind it. ChartSchool is plain about where it stops helping: "securities spend much time in trading ranges, which renders moving averages ineffective." It adds that "when there's no strong trend, a moving average crossover system will produce many whipsaws."
Turn that weakness into a test. Put an EMA on the chart (NinjaTrader ships one, see our indicator list). If price keeps crossing it, up and then down and then up again, you are in the case that quote describes. A setup built on a trend has nothing to lean on there.
3. Have pushes past the edges come back inside?
ChartSchool says that when price breaks out of a range, "above or below, it signals that a winner has emerged." Its own example shows the other case. A stock in a five month range "briefly poked its head above" the top, and "a gap down a few days later nullified the breakout."
If the last few pushes above the high or below the low have come back inside the range, neither side has won yet. The market is still neutral, and a second entry toward either edge is a bet that the next push will hold when the last ones did not.
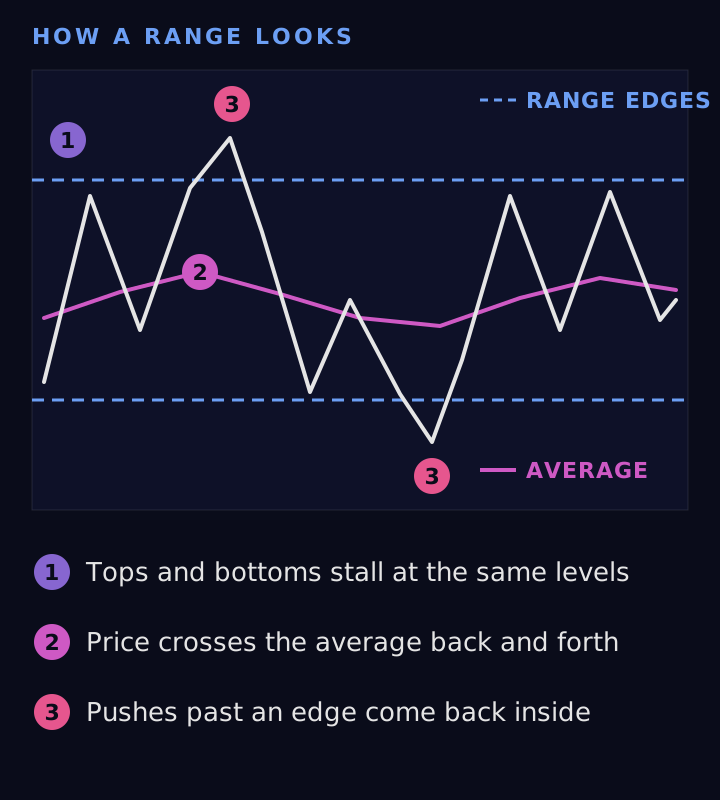
The three checks on one chart. Schematic, not a real chart.
What to do instead
Wait for the break
The Dow Theory chapter treats a range as neutral until it breaks, and warns "against attempting to anticipate the breakout." A second entry long a few ticks under the range high is an attempt to anticipate it. When price leaves the range and stays out, the trend definition can apply again, and so can your count.
Waiting has a cost. A break can fail too, as the example above shows, and by the time you are sure it has held, price is further from where it left the range.
Watch the old edge
ChartSchool notes that "when the price rises above a resistance level, it can become a new support," and that a broken support "can become a resistance level." After a break upward, a pullback toward the old range high is a pullback in a market that has picked a side, which is the context a second entry assumes.
Accept fewer trades
In our count of six and a half years of MES, the rule we use found 2.27 a day, and "about one session in eleven offers nothing at all." Skip the ones inside a range and you have fewer still. As that post put it: "You are not filtering a flood. You are waiting."
Read the failure
Our guide and our post on reducing false signals both treat a failed second entry as information, not noise. A second entry that fails under a range high fits the box you drew, so note it and let it confirm the range.
Where WiSE fits
WiSE marks the count on the chart as it forms, including second entries that fail. It does not read context. It has no trading range filter, so it marks a second entry under a range high the same way it marks one in a trend. The check in this post is yours to make before you act on the mark.
Frequently asked questions
Why did my second entry fail?
One reason has nothing to do with the count: context. A second entry is a pullback setup in a trend. In a trading range the pattern still forms, but there is no trend for price to resume. If the highs and lows before your entry were flat, the count was right and the context was missing.
Can you trade a second entry in a trading range?
A count will still mark it, but a range is neutral until it breaks. One way to handle it, following the Dow Theory warning against anticipating the breakout, is to wait until price leaves the range and then count again.
How do I know if the market is in a trading range?
The tops and bottoms stall near the same prices, price crosses its moving average back and forth, and pushes past the range high or low come back inside. Mark the high and low and treat it as a range until price breaks out.
Does WiSE filter out second entries in a trading range?
No. WiSE marks the count wherever the bars form it, and it has no trading range filter. Deciding whether the market is trending is up to you.
Futures trading involves substantial risk of loss and is not appropriate for all investors. Past performance is not indicative of future results.
Get the trading tool updates.
New releases, setup guides, and the occasional NinjaTrader tip. Roughly once a month.